By Cruise Market Watch Editorial Desk Published: March 14, 2013
Executive Overview
The global cruise industry in 2013 stood at a fascinating crossroads of unprecedented expansion, logistical optimization, and economic transformation. As modern cruise lines continued to roll out mega-ships capable of carrying thousands of passengers, the pressure on global port infrastructure intensified exponentially. Destinations around the world were no longer merely scenic stops on a leisurely itinerary; they functioned as high-stakes economic engines, multi-modal transport hubs, and complex logistical ecosystems that had to process hundreds of thousands of travelers with clockwork precision.
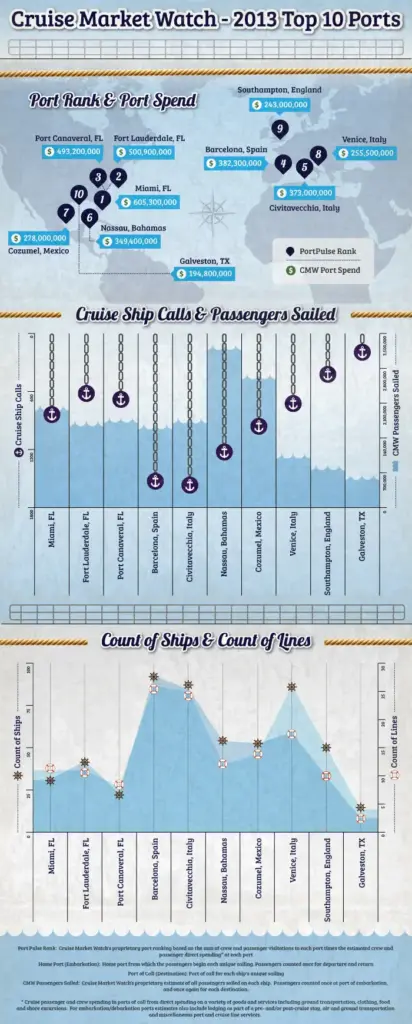
In this comprehensive report, we examine the definitive rankings for the Top 10 Cruise Ports in the World for 2013, drawing upon proprietary deployment data, passenger capacities, destination itineraries, and authoritative economic impact models. Derived from foundational metrics managed by Cruise Market Watch, alongside debarkation and expenditure metrics provided by Business Research & Economic Advisers (BREA), the Florida-Caribbean Cruise Association (FCCA), and Cruise Lines International Association (CLIA), this analysis sheds light on the titans of global maritime tourism.
Beyond merely listing the top ports, this investigation explores the underlying mechanics driving their dominance. We analyze how regional homeports captured the lion’s share of embarkations, how infrastructure investments paid off for local economies, and how environmental and logistical challenges shaped the operational realities of the world’s most-visited marine terminals. Whether measured by total passenger throughput, direct port spending, or strategic geographic positioning, the ports featured in our 2013 top-ten list represent the absolute pinnacle of contemporary cruise operations.
Detailed Chronology: The Evolution of Cruise Port Dominance up to 2013
To understand the landscape of cruise ports in 2013, one must look back at the evolutionary trajectory that transformed sleepy coastal towns and industrial harbors into hyper-efficient tourism gateways.
The Shift Toward Mega-Hubs (Late 1990s – Early 2000s)
For decades, cruising was viewed primarily as a niche luxury market. However, the turn of the millennium marked the advent of the "floating resort" concept. As shipbuilders began producing vessels exceeding 100,000 gross tons, traditional ports found themselves functionally obsolete. Channels were too shallow, turning basins were too narrow, and terminal facilities lacked the capacity to handle simultaneous passenger check-ins for 3,000 to 5,000 travelers at a time.
During this era, ports in South Florida—most notably Miami and Fort Lauderdale (Port Everglades)—established themselves as the undeniable epicenters of the global cruise trade. They invested heavily in dredging operations, state-of-the-art terminal architecture, and streamlined customs and border protection processes. By the mid-2000s, these ports had secured a dominant market share of Caribbean-bound itineraries, setting a gold standard for turnaround efficiency.
The Mediterranean Boom (Mid-2000s – 2010)
As the Caribbean market matured, major cruise operators aggressively diversified their global footprints, setting their sights on the rich cultural tapestries and geographic diversity of the Mediterranean. Ports such as Barcelona, Civitavecchia (Rome), and Venice experienced exponential year-over-year growth. European municipalities recognized the immense economic windfall of cruise tourism, leading to strategic public-private partnerships aimed at upgrading passenger reception facilities and improving rail and air connectivity to nearby urban centers.
The 2013 Landscape: Resilience and Specialization
By 2013, the global cruise industry had successfully weathered the lingering economic headwinds of the 2008 financial crisis. Passenger volumes globally were projected to surpass 21 million, putting immense demand on port infrastructure. The top ports in 2013 were no longer just passive docking locations; they were highly specialized logistical nodes. Turnaround ports (homeports) optimized baggage handling, provisioning logistics, and passenger processing, while ports-of-call perfected the art of the high-volume, single-day shore excursion.
Supporting Context & Metrics: Decoding the 2013 Top 10 Port Data
Evaluating a cruise port requires looking beyond raw passenger headcounts. The true value of a port is a complex matrix of passenger capacity, average length of stay, crew and passenger debarkation rates, and direct economic contributions to the local destination.
Methodology and Data Sources
The foundational data utilized in compiling the 2013 rankings incorporates several distinct pillars:
Ship Itineraries and Deployment: Unique destination schedules, routing patterns, and scheduled sailing days compiled directly by Cruise Market Watch.
Passenger and Crew Capacity: Maximum double-occupancy and total berth capacities of the vessels calling on each port throughout the 2013 calendar year.
Economic Multipliers: Debarkation rates and onshore spending estimates derived from extensive research models provided by Business Research & Economic Advisers (BREA), the Florida-Caribbean Cruise Association (FCCA), and Cruise Lines International Association (CLIA).
The Economic Ripple Effect
Onshore spending varies dramatically depending on whether a port functions as a homeport or a port-of-call.
Homeports (such as Miami, Port Canaveral, and Fort Lauderdale) generate massive economic impact through pre- and post-cruise hotel stays, local dining, taxi and ground transportation, airline connectivity, and provisions provisioning (fuel, food, and supplies loaded onto the ship).
Ports-of-Call (such as Nassau, Cozumel, and various Mediterranean destinations) derive their economic value from high-volume, short-duration tourist spending, including shore excursions, retail shopping, dining, and local attractions.
According to BREA and CLIA metrics, an average cruise passenger spent between $70 and $150 per port-of-call visit in 2013, while homeport passengers and crew members injected significantly higher capital per capita due to lodging and logistical provisioning requirements.
Official Statements & Industry Insights
As the 2013 cruise season unfolded, industry leaders, port authorities, and maritime economists offered critical perspectives on the pressures and opportunities facing the world’s premier cruise hubs.
The Infrastructure Challenge
In statements released during the 2013 Seatrade Cruise Shipping convention, CLIA representatives emphasized that port infrastructure development was the single most critical bottleneck facing the expansion of the global fleet.
"The relationship between cruise lines and port authorities has evolved from a transactional arrangement into a strategic partnership," noted a leading maritime analyst during the summit. "When a cruise line commits a multi-billion-dollar vessel to a specific route, the destination port must guarantee that terminal facilities, channel depths, and local supply chains can scale accordingly. In 2013, the ports that secured top-tier status are those that proactively invested in future-proofing their facilities."
Economic Impact on Host Communities
Local municipal leaders echoed the sentiments of economic empowerment, while acknowledging the ongoing need to balance tourism growth with local community preservation.
"Cruise tourism is a vital economic catalyst for our region, supporting thousands of direct and indirect jobs in hospitality, transport, and retail," stated a representative from a leading Caribbean port authority. "However, the challenge of 2013 and beyond is managing peak-day congestion. Ensuring a seamless experience for the passenger while maintaining the quality of life for local residents requires sophisticated crowd management and staggered ship scheduling."
Future Outlook: The Next Horizon for Global Cruise Ports
Looking past the benchmarks established in 2013, the horizon for global cruise ports revealed both exciting opportunities and complex structural hurdles. The decisions made by port authorities in 2013 laid the groundwork for how maritime tourism evolved over the subsequent decade.
1. The Arrival of the Ultra-Mega Ships
With shipbuilders pushing past the 5,000-passenger threshold, ports that failed to adapt risked being phased out of primary itineraries. The future clearly favored ports capable of accommodating Oasis-class vessels and their successors. This necessitated multi-million-dollar investments in wider berths, reinforced pier aprons, advanced gangway systems, and high-capacity baggage handling facilities.
2. Environmental and Sustainability Imperatives
By 2013, environmental scrutiny on the cruise industry was mounting. Forward-thinking ports began exploring and implementing shore-power infrastructure (Cold Ironing), allowing docked ships to plug into local electrical grids rather than running heavy diesel auxiliary engines. Furthermore, waste management capabilities—including greywater processing and solid waste recycling facilities at ports—became key differentiators for eco-conscious cruise lines.
3. Geographic Diversification
While traditional powerhouses in the Caribbean and the Mediterranean continued to dominate the top 10 rankings, emerging regions—such as Asia-Pacific (particularly China), Alaska, and Northern Europe—began showing explosive growth curves. Port authorities in these developing regions closely studied the operational models of the 2013 global leaders to build scalable, world-class infrastructure from the ground up.
Conclusion
The data and insights surrounding the top 10 cruise ports of 2013 illustrate an industry characterized by robust economic vitality, meticulous logistical coordination, and relentless ambition. As cruise lines continued to push the boundaries of maritime engineering, the ports that welcomed them proved indispensable to the global tourism economy. By analyzing the capacities, spending habits, and infrastructural demands highlighted in this report, industry stakeholders gained a clearer understanding of the forces shaping the high seas—and the vital harbors that anchor them.
For a detailed visual breakdown of the data metrics, passenger capacities, and specific port rankings, refer to the official Cruise Market Watch infographics and supplementary research documentation published throughout the 2013 fiscal year.