







Published by Cruise Market Watch
March 14, 2013
The global cruise industry in 2013 stood as a towering pillar of the international travel and leisure sector, driven by unprecedented passenger volumes, innovative ship architecture, and a rapidly expanding global footprint. As mega-ships continued to enter commercial fleets, the logistical hubs servicing these floating resorts faced extraordinary demands. Released in March 2013 by Cruise Market Watch, the definitive ranking of the world’s top 10 cruise ports provided an illuminating x-ray into where international maritime tourism concentrated its massive economic firepower.
Far from being mere transit points for embarking and disembarking vacationers, the premier ports of 2013 functioned as multi-billion-dollar economic ecosystems. They injected vital capital into local municipalities, supported hundreds of thousands of jobs, and dictated the operational rhythms of major cruise lines including Royal Caribbean, Carnival Corporation, and Celebrity Cruises. This comprehensive analysis delves into the structural dynamics of the top-tier cruise ports of 2013, examining the empirical data, methodological frameworks, economic multiplier effects, and the shifting paradigms that shaped the future of global port management.
Detailed Chronology: The State of Maritime Tourism in Early 2013
To understand the operational realities of the top 10 cruise ports in March 2013, one must examine the macroeconomic and industry-specific milestones that characterized the period. The preceding years had seen the global travel market recover from the 2008 financial crisis, albeit with shifting consumer preferences and regional tourism growth patterns.
- January 2013: Major cruise operators reported robust advance bookings for the upcoming spring and summer seasons, putting immense pressure on port authorities to streamline terminal handling capacities. The Caribbean continued to dominate winter itineraries, while the Mediterranean prepared for an influx of European and North American travelers.
- February 2013: Industry analysts noted a significant uptick in homeport diversification. While traditional powerhouse ports in Florida maintained their stranglehold on total passenger volume, secondary and tertiary ports across Europe and Asia began upgrading infrastructure to capture expanding market share.
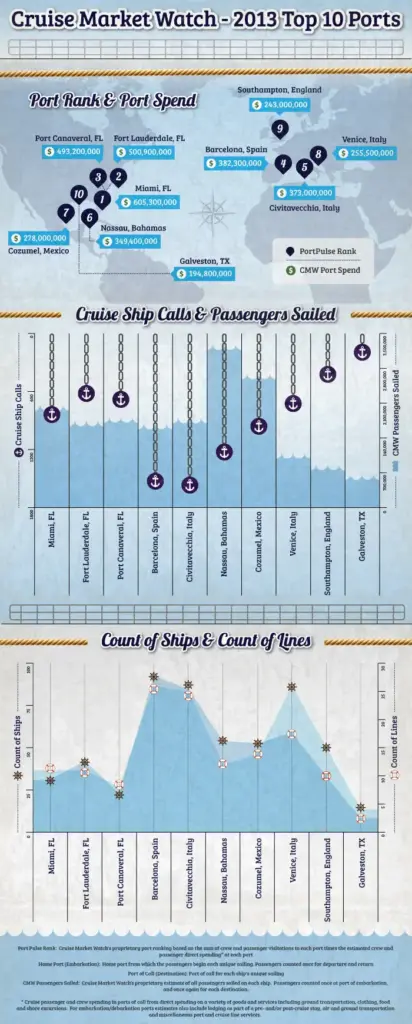
- March 14, 2013: Cruise Market Watch officially published its landmark infographic and data breakdown detailing the top 10 cruise ports in the world. The release served as an empirical benchmark for port authorities, municipal governments, and cruise executives, mapping out passenger throughput, economic yields, and infrastructural capacity constraints.
- Late Q1 2013: Port authorities worldwide began revisiting long-term master plans. Recognizing the trend toward larger vessels—exemplified by Royal Caribbean’s Oasis-class ships—ports featured in the top 10 rankings accelerated investments in deeper dredging, expanded passenger terminals, and advanced baggage-handling systems to prevent bottlenecks.
Supporting Context & Metrics: Unpacking the 2013 Top 10 Data
The analytical rigor behind the 2013 Cruise Market Watch ranking relied on a synthesis of proprietary cruise intelligence and industry-standard economic impact models. Evaluating a port’s standing required examining far more than simple passenger headcounts; it demanded a nuanced understanding of homeport versus port-of-call dynamics, average passenger spending, and crew economic contributions.

Methodology and Data Sources
The foundational metrics utilized in compiling the 2013 rankings were drawn from a tripartite data architecture:
- Itinerary Analytics: Cruise Market Watch tracked each ship’s unique destination itineraries, scheduled sailing days, and maximum passenger capacities. This allowed analysts to calculate theoretical maximum passenger throughput alongside actual utilization rates.
- Debarkation Dynamics: Crew and passenger debarkation rates were factored into the equation, acknowledging that not all passengers or crew members disembark at every port of call. Homeports naturally exhibited a 100% debarkation and embarkation rate, whereas ports of call experienced variable percentages based on excursion appeal and port time.
- Economic Impact Modeling: Estimates regarding direct port spending—including passenger expenditures on shore excursions, retail, dining, and transportation, alongside crew spending patterns—were derived from comprehensive studies conducted by Business Research & Economic Advisers (BREA), the Florida-Caribbean Cruise Association (FCCA), and the Cruise Lines International Association (CLIA).
The Anatomy of a Top-Tier Port
In 2013, the hierarchy of global cruise ports was heavily skewed toward North American homeports, particularly those situated in the state of Florida. Ports such as Miami, Port Everglades (Fort Lauderdale), and Port Canaveral commanded the upper echelons of the list due to several distinct advantages:
- Proximity to Key Itineraries: Their strategic geographic location allowed for seamless access to the Caribbean, the Bahamas, and transatlantic repositioning routes.
- Infrastructure Scale: These hubs featured multi-terminal facilities capable of simultaneously processing thousands of passengers, provisioning massive vessels with food, fuel, and supplies within tight turnaround windows.
- Aviation Connectivity: Proximity to major international airports ensured frictionless fly-cruise transitions for travelers arriving from across the globe.
Simultaneously, European giants—particularly in the Mediterranean—represented the pinnacle of historical and cultural cruising. Ports in regions like the Western Mediterranean balanced high passenger volumes with the delicate task of preserving historical urban centers while managing mass tourism flows.
Official Statements and Industry Perspectives
The release of the 2013 port rankings prompted widespread discussion among cruise line executives, port directors, and tourism economists regarding the sustainable management of global maritime hubs.
Commenting on the infrastructural demands of the era, maritime economists emphasized that the relationship between cruise lines and port cities was undergoing a fundamental transformation. No longer viewed merely as passive service providers, competitive ports in 2013 were actively partnering with cruise lines to co-invest in terminal modernization.

"The modern mega-ship is an economic engine that requires precision logistics on land. The ports that succeed in our rankings are those that have successfully bridged the gap between maritime operational efficiency and local municipal capacity, ensuring that every passenger translates into sustainable local economic value."
— Industry Analysis Synthesis, Cruise Market Watch (March 2013)
Furthermore, representatives from organizations such as the Cruise Lines International Association (CLIA) highlighted the critical role that comprehensive data collection played in future planning. By quantifying the precise economic footprint of passengers and crew—from local taxi drivers and tour operators to port authorities and retail establishments—the 2013 data provided municipal leaders with the empirical justification needed to support continued waterfront development and zoning accommodations.
Future Outlook: The Evolution of Cruise Port Infrastructure Beyond 2013
Looking ahead from the vantage point of 2013, the landscape of global cruise ports faced both immense opportunities and complex challenges. The insights provided by the Cruise Market Watch top 10 data served as a crystal ball for the trends that would define the remainder of the decade and beyond.
1. The Imperative of Scalability and Dredging
As cruise lines continued to order larger vessel classes, port authorities faced immediate pressure to deepen navigation channels and widen turning basins. Ports unable to accommodate the next generation of ships risked falling out of the top tier as deployment strategies shifted toward deeper, more modernized facilities.
2. Congestion Management and Sustainable Tourism
With millions of passengers funneling through premier ports of call, the issue of urban congestion came to the forefront. Forward-thinking ports began implementing intelligent transportation systems, staggering ship arrival times, and developing peripheral excursion nodes to distribute tourist traffic more evenly, mitigating local friction and enhancing the passenger experience.

3. Technological Integration in Terminal Operations
The manual processing bottlenecks of the past were rapidly becoming obsolete. The future pointed toward biometric check-ins, automated baggage tracking, and digitized port clearance procedures. Top-tier ports in 2013 were laying the groundwork for the smart ports of the future, where data analytics and automation would streamline the passenger journey from curb to ship.
4. Geographical Diversification
While the 2013 rankings underscored the traditional dominance of Caribbean and Mediterranean hubs, emerging markets in Asia-Pacific, particularly China, and the Arabian Gulf signaled a shift in global deployment. The long-term outlook suggested that future iterations of the top 10 lists would increasingly feature eastern hemisphere ports as the Asian cruise consumer base expanded exponentially.
Conclusion
The Cruise Market Watch top 10 cruise ports data released on March 14, 2013, captured a pivotal moment in the history of maritime travel. It documented an industry operating at peak momentum, underpinned by complex logistical networks and substantial economic contributions to host communities. By examining the interplay between itinerary design, passenger capacity, debarkation metrics, and direct spending, stakeholders gained invaluable insights into what it took to lead the global cruise economy. As the industry continued to evolve past 2013, the benchmarks established in this report remained essential reading for anyone seeking to understand the past, present, and future of the world’s most dynamic travel sector.